DHIS2 indicators to Power BI DAX
Instantly convert DHIS2 indicator expressions to Microsoft Power BI DAX measures, eliminating complex and cumbersome manual work.
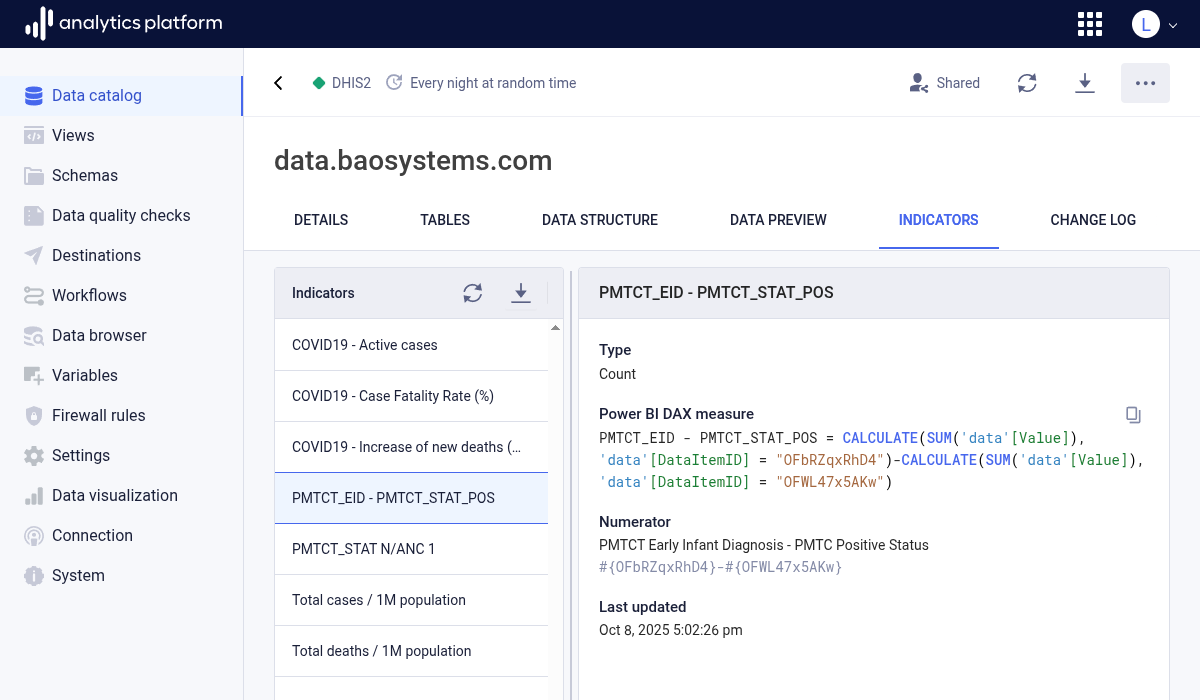
Convert DHIS2 indicators
From the indicators tab in the DHIS2 data pipeline overview, every indicator in the DHIS2 system is displayed. After selecting an indicator, the indicator expression is automatically converted to a Microsoft Power BI DAX expression.
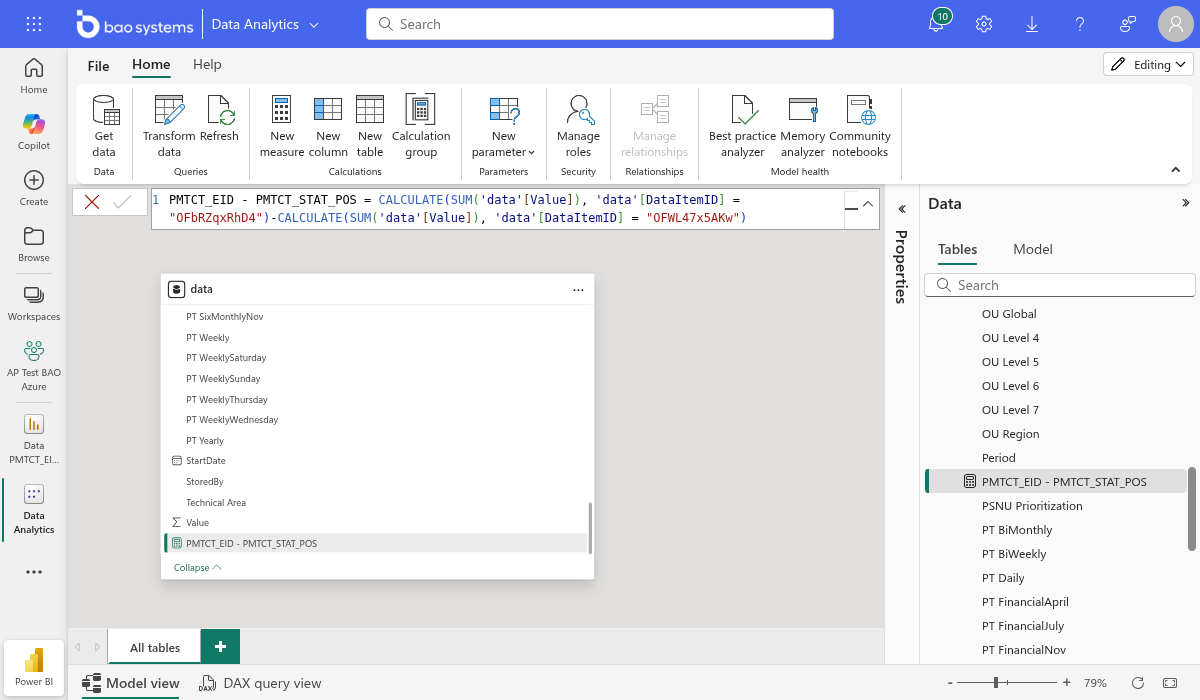
Create DAX measures in Power BI
After loading data with the DHIS2 data pipeline and creating a semantic model in Power BI, you can instantly create new measures by simply copying the generated DAX expression from AP and pasting it directly into Power BI.
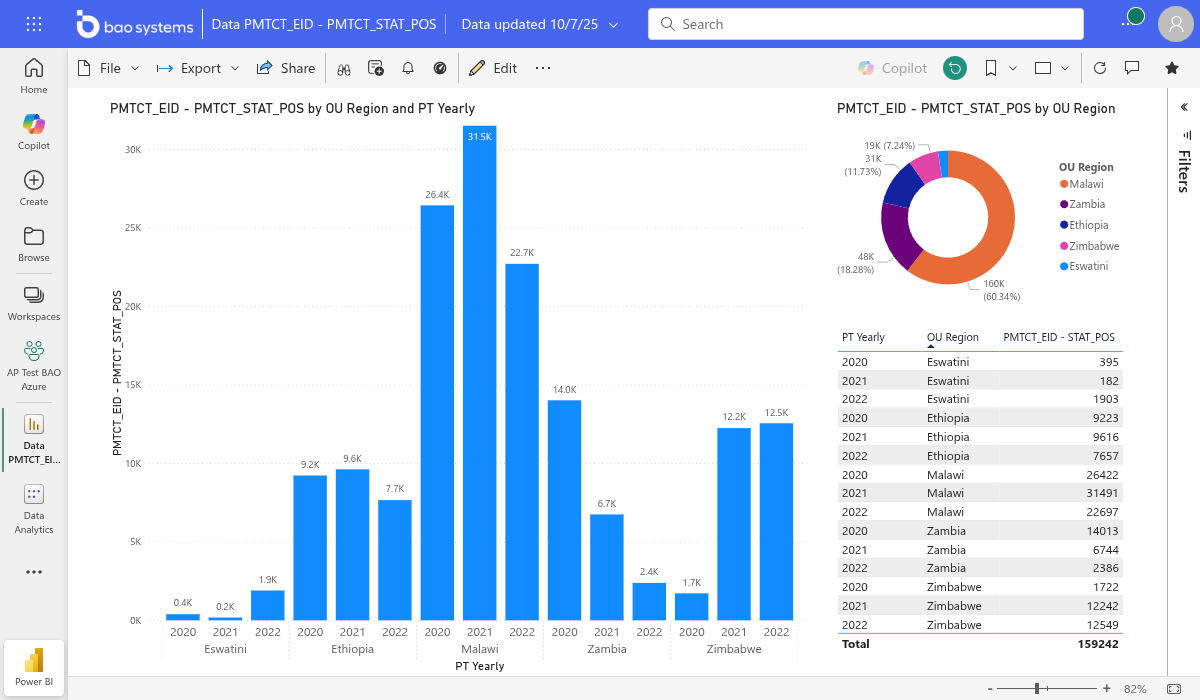
Create Power BI dashboards
In the Power BI report designer, new measures can be easily added to visualizations. In the example below, the measure is used on the Y-axis of a column chart grouped by region and year.
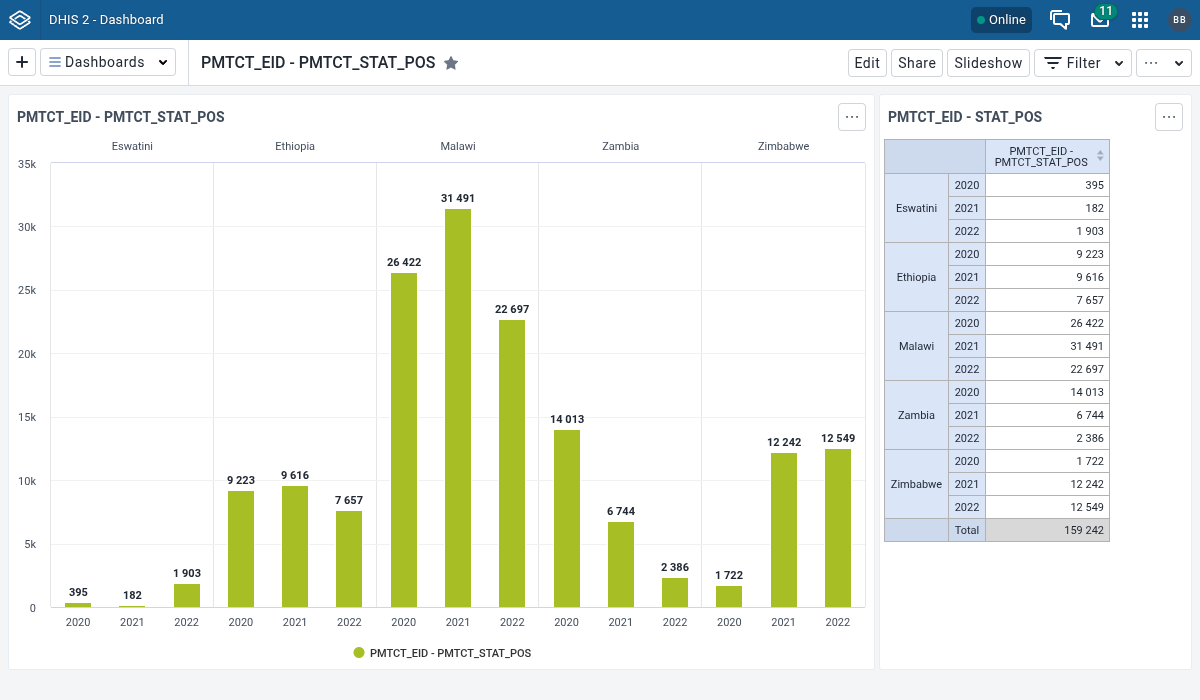
Compare with DHIS2 dashboards
In DHIS2, a similar set of visualizations can be created to verify consistency of the calculations. In the DHIS2 dashboard example below, the numbers can be seen to match up with Power BI.